UK Commercial Real Estate Sold Prices Explained
A complete guide to UK commercial real estate sold prices. Learn how to find reliable data, analyze market trends, and make smarter investment decisions.

When a commercial property deal is done and dusted, the most important number isn't the one on the initial listing or the figure in a valuation report. It’s the final sold price—the actual amount that changed hands.
This figure, officially recorded by organisations like the UK's Land Registry, represents the property's true market value at that specific moment. It cuts through the seller's optimism and the surveyor's estimates to give you a concrete, reliable benchmark. Getting to grips with this number is the first step to making smarter property decisions.
Decoding What a Sold Price Truly Means
In commercial real estate, you're constantly bombarded with figures. There’s the asking price splashed across a brochure, the formal valuation in a surveyor’s report, and endless forecasts about future growth. Each has its role, but only one tells you what a property was actually worth to a buyer on the day of the sale: the sold price.
Let’s break it down. An asking price is really just the seller's opening offer—their wish list. A valuation is an expert’s professional opinion, a carefully calculated estimate based on market data and their own experience.
But the sold price? That’s the final handshake. It's the real money that moved from one bank account to another. It’s not a hope or an estimate; it's a historical fact.
To really clarify the distinction, let's look at these three key metrics side-by-side.
Asking Price vs. Valuation vs. Sold Price
| Metric | Definition | Purpose | Reliability for Market Analysis |
|---|---|---|---|
| Asking Price | The initial price a seller advertises for a property. | To attract potential buyers and set a starting point for negotiations. | Low. Often inflated and doesn't reflect the final transaction value. |
| Valuation | A professional estimate of a property's market worth by a chartered surveyor. | Used for financing, accounting, or strategic planning. | Medium. An expert opinion, but still a prediction, not a confirmed sale. |
| Sold Price | The final, legally recorded price a property is sold for. | To provide a definitive record of the property's market value at the time of sale. | High. The most accurate and reliable data point for market analysis. |
As you can see, while asking prices and valuations are part of the journey, the sold price is the destination—it's the only figure that gives you undeniable proof of market value.
The Bedrock of Market Analysis
So, why does this matter so much? Because sold prices are the bedrock of any solid investment strategy. They ground your decisions in reality, not speculation. Without this hard data, you're essentially flying blind, making multi-million-pound decisions based on little more than a hunch.
This data is essential for a few key activities:
- Accurate Valuations: Surveyors rely heavily on the sold prices of similar, recently transacted properties (often called 'comparables' or 'comps') to work out the current market value of another asset.
- Spotting Trends: By tracking sold prices over time for a particular property type—like industrial sheds or high-street shops—you can spot emerging hotspots and get ahead of market shifts.
- Smarter Negotiations: Walking into a negotiation armed with the facts about what similar properties actually sold for gives you a massive advantage, whether you're buying or selling.
This image shows the clear link between average sold prices, different property types, and key UK markets.
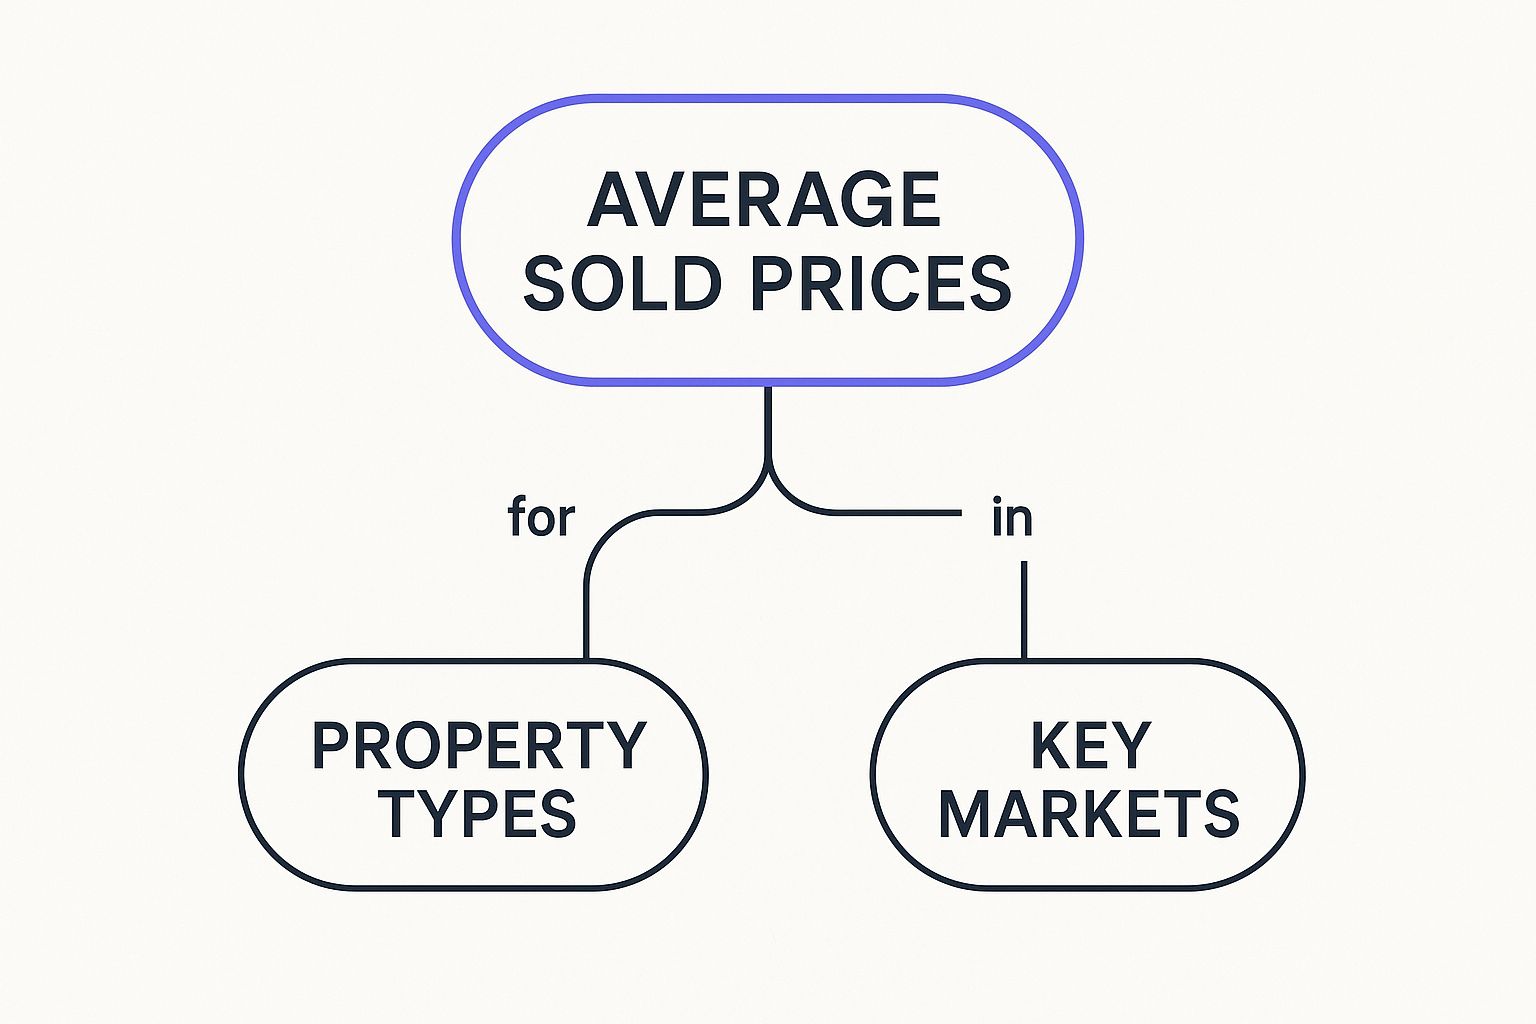
The map drives home a simple point: a property's final price tag is a direct result of what it is and where it is.
From Data Point to Strategic Insight
Every single transaction logged with the Land Registry adds another piece to the giant jigsaw puzzle of the UK commercial property market. According to the latest ONS data, the total value of non-domestic property in the UK was estimated at £955 billion in 2022, highlighting the immense scale of this market.
For instance, if you notice a string of high sold prices for logistics hubs near a major motorway, that’s a strong signal of booming demand in the e-commerce sector. This aligns with real-world trends, where the industrial and logistics sector saw capital values increase by 1.8% in the first quarter of 2024 alone. It’s no longer just a theory; it’s a fact proven by real money.
A sold price isn't just a number; it is the market's final verdict on a property's value at a specific moment in time. It captures the outcome of negotiation, due diligence, and the economic climate, making it the most authentic data point available.
By understanding the journey from the initial hope (the asking price) to the final reality (the sold price), you can navigate the market with genuine confidence. This foundational knowledge lets you cut through the noise and focus on what truly drives value.
Finding Reliable UK Sold Price Data
Solid commercial real estate sold prices are the bedrock of any smart property investment. But here’s the thing: knowing where to find that information is the real first step. The data is public, sure, but it’s scattered across different platforms, each with its own quirks. To get the full picture, you need to know which sources to trust and how to piece them together.
Your starting point should always be the official keeper of the records for property deals in England and Wales: HM Land Registry. Think of this government department as the ultimate authority on who owns what and for how much it was sold.
For anyone digging into commercial real estate sold prices, the Land Registry is indispensable. It gives you the final, legally recorded price paid for a property. This is a hard, factual data point that cuts right through the noise of asking prices and speculative valuations.
The Official Source: HM Land Registry
The Land Registry’s Price Paid Data is a treasure trove, holding over 28 million records of property sales in England and Wales since 1995. While it’s famous for residential data, it’s just as vital for commercial transactions—as long as they’re registered, of course.
There is one crucial detail to keep in mind, though: the time lag. A sold price doesn't just pop up on the Land Registry database the moment a deal is done. The registration process itself can take weeks, sometimes even months. This means the very latest data you see might actually reflect market conditions from the previous quarter.
Here’s a look at the official HM Land Registry portal, your primary source for this foundational data.

This just reinforces its status as an impartial and official source. It's not a private company with an agenda; it’s a non-ministerial government department focused on recording the facts.
Commercial Portals and Specialist Providers
The Land Registry gives you the definitive final price, but other platforms provide the colour and more immediate insights. Commercial property portals like Rightmove and Zoopla are fantastic for getting the backstory. They can show you the original asking prices, the marketing brochures, and even tell you how long a property sat on the market.
Why does that matter? When you compare the initial asking price to the final Land Registry sold price, you uncover the negotiation gap. According to Zoopla, properties across the UK are selling for an average of £11,250 below the asking price, a gap of 4.5%. This detail can tell you a lot about market sentiment and how confident buyers are feeling.
For a much deeper dive, you'll want to look at specialist data providers. These platforms do the heavy lifting for you. They gather data from the Land Registry and other places, then enrich it with powerful analytics. They typically offer:
- Price per square foot calculations: A standard metric that makes it easy to compare value between properties.
- Yield analysis: Absolutely essential for figuring out your potential return on investment.
- Market trend reports: These give you the big-picture view of how a particular sector is performing.
Yes, these services often come with a subscription, but the analytical edge they provide can save you countless hours of grunt work.
The smartest research strategy is to cross-reference multiple sources. Use the Land Registry for factual accuracy, commercial portals for the historical context, and specialist providers for advanced analytics. Triangulating the data like this gives you the most robust and reliable view of the market.
Building a Complete Market Picture
No single source ever tells the whole story. A savvy investor knows how to weave together threads of information from different platforms to create a clear narrative.
For instance, you might spot a recently sold property on a commercial portal. Your next move would be to check the Land Registry's Price Paid Data to verify the final sale price, keeping that potential time lag in mind.
Finally, you could plug that sale into a platform like Property Insights. This lets you analyse it in the context of local trends, comparing its price per square foot to other recent sales in the same neighbourhood.
This multi-layered approach takes you from being a simple collector of commercial real estate sold prices to someone who truly understands what they mean. It's how you turn raw data into actionable intelligence, giving you the professional edge to make decisions with real confidence.
The Key Factors Driving Property Values
A commercial property's final sold price is never just a number plucked out of thin air. It’s the outcome of a complex tug-of-war between large-scale economic forces and the unique, granular details of the asset itself. To really understand commercial real estate prices and spot genuine value, you need to get to grips with both sides of this equation.
Think of it like this: the wider economy sets the overall weather for the market, but a property's specific features determine how well it handles the climate. You can't just look at one without the other to understand why a building sold for what it did.
The Macroeconomic Climate
At the highest level, the health of the UK economy sets the tone for the entire commercial property market. These are the powerful currents that shift investor confidence and shape the cost of borrowing, influencing every single transaction.
Here are the big-picture factors to watch:
- Bank of England Interest Rates: When the Bank of England raises interest rates to manage inflation, borrowing becomes more expensive. For instance, the Bank Rate stood at 5.25% in early 2024. This higher cost of financing can dampen investor demand and put downward pressure on sold prices.
- GDP Growth: A rising Gross Domestic Product (GDP) points to a healthy, expanding economy. According to the ONS, UK GDP is forecast to grow modestly, which encourages businesses to expand and invest in new premises. This activity fuels demand and naturally supports property values.
- Investor Sentiment: You can't underestimate the power of confidence. A stable political landscape and positive economic forecasts encourage investment. Conversely, uncertainty, as seen during periods of political change, can make investors cautious, slowing market activity.
These forces create the backdrop against which every deal happens. A strong economy with low interest rates is the perfect recipe for rising property values, while a recession will almost always do the opposite.
Property-Specific Attributes
While the economic climate sets the stage, it's the individual character of a property that dictates its specific value. You could have two buildings that look similar on the same street, yet they could sell for wildly different prices. It all comes down to a handful of critical details that can make or break a deal.
These are the most influential property-specific factors:
- Location: The old saying "location, location, location" is a cliché for a reason—it's absolutely true. A retail unit on a bustling high street or an industrial warehouse with a direct link to the M1 will always fetch a premium over a similar property tucked away on a back road. Proximity to transport, local amenities, and a skilled workforce are massive value drivers.
- Asset Class and Condition: The type of property—whether it's an office, an industrial shed, or a retail park—and its physical state are fundamental. A brand-new, energy-efficient logistics hub is going to be worth a lot more than a tired, 1970s office block that needs millions spent on it.
- Lease Strength and Tenant Quality: For investment properties, this is arguably the most important factor of all. A long lease signed with a financially sound, blue-chip tenant (think Tesco or a government department) guarantees a secure, predictable income. That security is gold dust to investors and can dramatically inflate a property's value.
A property with a 15-year lease to a FTSE 100 company is more than just bricks and mortar; it's a reliable financial instrument. Investors are essentially buying that guaranteed income, which is why a strong tenant covenant can add millions to the final sold price.
The quality of this income stream is so crucial that it directly shapes the property's yield. You can explore this relationship in more detail in our guide on how to use a UK rental yield calculator.
This focus on secure income is reflected in wider market trends. The average rent for new commercial leases has shown steady growth, indicating continued demand from businesses. For example, industrial and logistics rents grew by 2.3% in the first quarter of 2024, demonstrating the sector's resilience.
How to Analyse UK Commercial Market Trends
Individual commercial real estate sold prices are the building blocks of market analysis. A single sold price tells you what one property was worth on one particular day. But when you start piecing them together, you begin to see the bigger picture—the market trends that show where capital is flowing and where the next big opportunities might be hiding. This is the leap from simply gathering data to generating powerful, actionable intelligence.

Turning raw sold price data into a coherent story is all about spotting patterns, comparing how different sectors are performing, and getting a feel for the market's pulse. This is where the real value lies. It allows you to look past individual deals and see the fundamental forces shaping the UK’s commercial property landscape.
Creating Standardised Benchmarks for Comparison
To compare different properties fairly, you need a common yardstick. Just looking at the final sale price isn't much help; a £2 million warehouse in Manchester is a completely different beast to a £2 million office in Mayfair. The simplest and most effective way to standardise everything is to work out the price per square foot (£/sq ft).
This one metric cuts through all the noise of varying property sizes and gives you a true like-for-like benchmark. The calculation is straightforward: just divide the final sold price by the property's total internal area.
Let's say a 10,000 sq ft industrial unit sells for £1.5 million. The maths looks like this: £1,500,000 / 10,000 sq ft = £150 per sq ft
Once you do this for every recent sale in an area, you can establish an average £/sq ft. This figure becomes your baseline for judging whether a new listing is overvalued, a potential bargain, or priced just right.
Identifying Regional Hotspots and Sector Performance
With a reliable metric like £/sq ft, you can start mapping out market trends with real precision. By tracking the average £/sq ft over time in specific cities or regions, you can pinpoint emerging hotspots long before they become common knowledge.
Imagine you crunch the numbers on recent sales and notice this:
- Manchester: Prime office space is achieving record rents, reaching over £43 per sq ft in 2023.
- London: In contrast, while still the most expensive market, rental growth in some sub-markets has been more subdued.
This data tells a compelling story. It suggests strong investor and occupier demand in key regional cities like Manchester, potentially signalling a shift in market dynamics. You can apply the exact same logic to different property sectors—pitting industrial against retail, or offices against leisure—to see which asset classes are outperforming the rest.
According to recent data, all-property capital values across the UK increased by 0.4% in the first quarter of 2024. However, this masks a significant divergence between sectors. The industrial sector saw values rise by 1.8%, while the retail sector experienced a decline of 0.4%, highlighting the importance of sector-specific analysis.
Understanding Market Velocity and Absorption
Beyond just the price, sold price data helps you understand market velocity—that is, the speed at which properties are being bought and sold. A high volume of transactions in a short space of time points to a hot, liquid market with plenty of buyer demand. On the flip side, if properties are sitting on the market for months before selling, it’s a clear sign of a cooler, more cautious climate.
This concept, often referred to as the absorption rate, is crucial. It tells you how quickly the available supply of commercial property is being "absorbed" by buyers.
A healthy market isn't just defined by rising prices, but by a consistent flow of transactions. High velocity shows that buyers and sellers are actively agreeing on value, which is a key indicator of market confidence and stability.
By analysing both the prices and the frequency of sales, you build a much richer, more nuanced picture of the market's health. It’s this combination of insights that transforms raw commercial real estate sold prices into a predictive tool. It helps you understand where the market has been and, more importantly, where it might be heading next. To stay on top of the latest trends, resources like Fundpilot's insights blog offer valuable perspectives on the ever-shifting dynamics of commercial property.
Using Price Indices and Reports for Context
Knowing the sold price of a single commercial property gives you a fantastic, street-level view of a specific deal. But to really grasp what's happening in the market, you need to pull back and see the bigger picture. This is where price indices and market reports shine—they’re like the satellite view that puts individual transactions into a much broader, more meaningful context.
Think of an index as a barometer for the entire commercial property market. It doesn't just track one sale; it follows the combined movement of hundreds, sometimes thousands, of properties. This aggregated data is brilliant for spotting market-wide momentum. It helps you see periods of growth, stability, or correction far more clearly than a single deal ever could.

This chart is a perfect example of how different commercial sectors perform over time. The key takeaway? Not all commercial property moves in the same direction or at the same speed. You might see the industrial sector booming while retail faces some serious headwinds.
Interpreting Key UK Market Indices
Several organisations publish indices tracking UK commercial property values, and each offers a slightly different lens on the market. These aren't just abstract numbers; they directly reflect investor sentiment and the real-world impact of economic shifts, like changes in the Bank of England's interest rates.
When you start digging into an index, you’re looking for trends over time:
- Upward Trend: This points to a "bull market," where confidence is high, demand is strong, and values are generally on the up.
- Downward Trend: This signals a "bear market," where sentiment is more cautious, and prices may be falling or stagnating.
- Flat Line: This suggests a period of stability or uncertainty, where the market isn't making any significant moves either way.
The latest ONS House Price Index for commercial property shows that prices paid for commercial buildings fell by 1.3% in the year to March 2024. This headline figure, however, varies significantly by sector and region, underscoring the need to look beyond the average.
Placing a Deal in a Market Context
Understanding these high-level trends adds a powerful strategic layer to your analysis. It helps you work out if a great deal you've found is part of a rising market or just an outlier in a declining one. This context is absolutely crucial for forecasting future performance and managing your risk.
An index provides the narrative for the market's story. It helps you understand if you're buying at the beginning of a growth chapter, the peak of the climax, or during a period of reflection.
This knowledge also helps with the practical side of a transaction. For example, knowing the market's direction can shape your negotiation strategy and even affect the final purchase costs. If you need a refresher on those associated costs, have a look at our guide on how to calculate Stamp Duty.
By combining the granular detail of sold price data with the broad perspective of market indices, you give yourself a complete view. It’s what allows you to make smarter, more confident investment decisions.
Putting Sold Price Data into Action
Knowing the theory behind commercial real estate sold prices is one thing, but actually using that knowledge to get ahead is where the real value lies. This is the point where raw data, like the figures from the Land Registry, becomes a powerful tool that gives you a genuine financial and strategic edge.
Whether you're an investor, a business owner, or a developer, this information can be put to work in very specific, powerful ways.
For investors, sold price data is the bedrock of every smart decision. When you’re eyeing up a potential acquisition, you no longer have to rely on the seller's asking price or just a gut feeling. Instead, you can build a compelling, data-backed offer by analysing sold price comparables – what we in the industry simply call ‘comps’.
Building a Data-Backed Offer for Investors
By digging into recently sold properties that are a close match in location, size, and type, you can establish a clear benchmark for what the market is actually paying. This doesn't just validate whether a deal is a good one; it gives you the confidence to negotiate from a position of strength.
Here’s a practical way to approach it:
- Step 1: Identify Comps: Your first job is to find three to five similar properties that have sold within the last six to twelve months in the immediate area.
- Step 2: Standardise the Value: To compare apples with apples, calculate the price per square foot for each of those sold properties. This gives you a consistent metric to work with.
- Step 3: Adjust for Differences: Now, make some common-sense adjustments. If your target property is in better nick, it might be worth a bit more. If it has a shorter lease, you'd rightly argue it's worth less.
- Step 4: Formulate Your Offer: Use this adjusted average price per square foot to calculate your offer. Suddenly, you have hard evidence to justify your price during negotiations.
This methodical approach shifts you from guesswork to a calculated strategy. For more ideas on how to frame your approach, our overview of different UK property investment strategies provides some extra context.
Strengthening Your Negotiating Position
This data isn't just for buyers. If you’re a business owner looking to either buy or sell your own premises, a solid grasp of local sold prices is your best negotiating tool.
When you’re selling, you can confidently set a realistic asking price backed by solid market evidence, which stops you from accidentally undervaluing your biggest asset. On the flip side, if you're buying a new base for your operations, knowing what similar units have recently sold for is your best defence against overpaying. You can walk into talks armed with facts, not just opinions.
Understanding the local sold price landscape transforms negotiation from an art into a science. It grounds the conversation in objective reality, giving you a firm platform from which to argue your case, whether you are buying or selling.
Assessing Project Viability for Developers
Finally, for property developers, historical sold price data is absolutely critical for figuring out if a new project is financially viable. Before a spade even hits the ground, a developer has to forecast the Gross Development Value (GDV) – the estimated value of the finished scheme.
This projection is almost entirely based on the current sold prices of similar new-build or refurbished commercial properties in the area. Getting the commercial real estate sold prices right is the key input that determines whether a project is profitable enough to even get started.
Your Questions Answered
When you start digging into commercial property prices, a few questions always seem to pop up. Let's tackle some of the most common ones head-on, giving you the clear, straightforward answers you need.
How Long Until a Sold Price Appears on the Land Registry?
This is a classic. You know a deal has closed, but the price is nowhere to be found online. Why the delay?
It’s completely normal for a sold price to take anywhere from a few weeks to several months to appear on HM Land Registry. This isn't a glitch; it's just the time it takes for all the legal and administrative paperwork to be processed and officially logged.
Just remember this when you're looking at data. The most recent prices you see might actually reflect what the market was doing three to six months ago. Factoring this lag into your thinking is key to getting a true feel for today's market.
Is Commercial Property Sold Price Data Public in the UK?
For the most part, yes. In the UK, sold prices for registered freehold and long leasehold commercial properties are public information, thanks to HM Land Registry.
This commitment to transparency is a massive advantage. It means anyone – from a seasoned investor to a small business owner – can ground their decisions in solid facts rather than just hearsay or optimistic valuations. While there are a handful of very rare exceptions, you can count on the vast majority of transactions being publicly recorded.
This open access to commercial real estate sold prices is what keeps the UK market fair and accountable. It lets you base your analysis on hard evidence, not just speculation.
Why Would a Sold Price Be Very Different from the Asking Price?
It's easy to get fixated on the asking price, but in reality, it's just the opening bid in a negotiation. The final sold price can end up miles away from it, and there are a few common reasons why:
- Smart Negotiation: A savvy buyer, or one with a good agent, might successfully argue the price down, especially if the property has been lingering on the market. Rightmove data often shows how long a property has been listed, providing negotiation leverage.
- Due Diligence Discoveries: The survey is often where things get interesting. If it uncovers hidden problems like a leaky roof or structural issues, the buyer has serious leverage to renegotiate the price.
- A Bidding War: On the flip side, if a property is in a hot area and attracts multiple offers, a competitive bidding situation can push the final price well above what the seller was initially asking.
- Shifting Tides: The market doesn't stand still. A sudden Bank of England interest rate hike or a change in local planning laws can affect a property's value between the time it’s listed and the day the deal closes.
We've answered some of the most common questions about commercial property data here, but there are always more. Below is a quick-reference table to summarise these key points.
| Frequently Asked Questions |
|---|
| Q1: How long until a sold price appears on the Land Registry? |
| We'll explain the typical time lag, which can be several months, and the administrative reasons for this delay to help manage expectations. |
| Q2: Is commercial property sold price data public in the UK? |
| A clear confirmation that for registered freehold and long leasehold properties, this data is public information available through HM Land Registry, and we'll note any rare exceptions. |
| Q3: Why would a sold price be very different from the asking price? |
| This answer covers the most common reasons, such as successful negotiation, issues discovered during due diligence, a competitive bidding situation, or special sale conditions like a transaction between related parties. |
Hopefully, these answers clear up some of the mystery behind commercial property sold prices and help you approach your research with more confidence.
Ready to stop guessing and start analysing with confidence? Property Insights combines official data sources, including Land Registry sold prices, with powerful analytics to give you a complete view of the market. Find your next investment, validate a deal, or track market trends with our all-in-one platform.
Property data, one integration
Build with UK property data
Browse our APIs for valuations, sold prices, EPCs, crime, schools, ownership and more.